Disinfection
Disinfection reduces pathogen levels below discharge permit limits prior to discharge to the South Platte River.
Disinfection is the process of inactivating or reducing the number of human pathogens to an acceptable level of risk. Metro’s disinfection goals are set by the Colorado Department of Public Health and Environment through the Colorado Discharge Permit System, based on state water quality standards developed under the Clean Water Act. At both facilities, Metro maintains two disinfection goals for the Escherichia coli permit limits: Stay below the 30-day geometric mean of 126 colony forming units per 100 ml and the 7-day geometric mean of 252 colony forming units per 100 m. This also serves as the final point in the treatment process to reduce the effluent temperature within discharge permit limits, if not addressed elsewhere in the process.


Robert W. Hite Treatment Facility
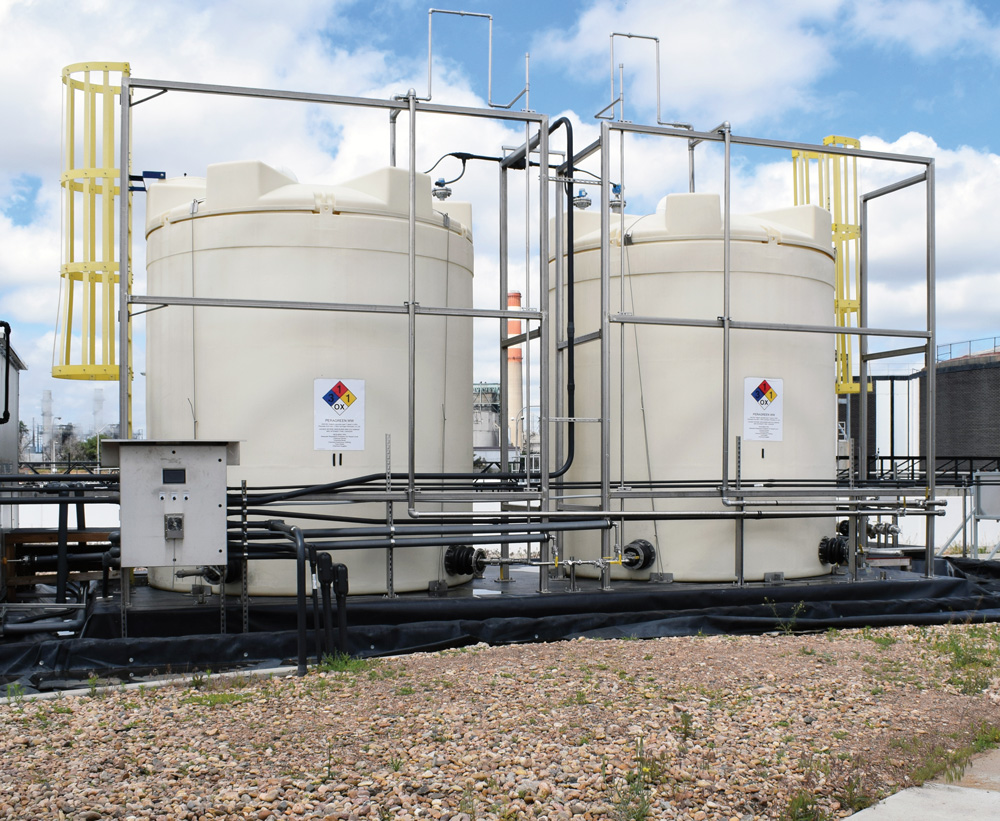
In 2018, the primary disinfectant at the Robert W. Hite Treatment Facility (RWHTF) was changed from sodium hypochlorite (SHC) to peracetic acid (PAA). Both chemicals are strong oxidants (good at reducing pathogens), but PAA has advantages over SHC including reduced chemical addition, reduced salinity in the treated effluent, reduced aquatic toxicity, and elimination of disinfection byproducts. PAA works by damaging the biological processes of bacteria and making them unable to reproduce. It does this by damaging the cell wall and oxidizing proteins and enzymes.
Northern Treatment Plant
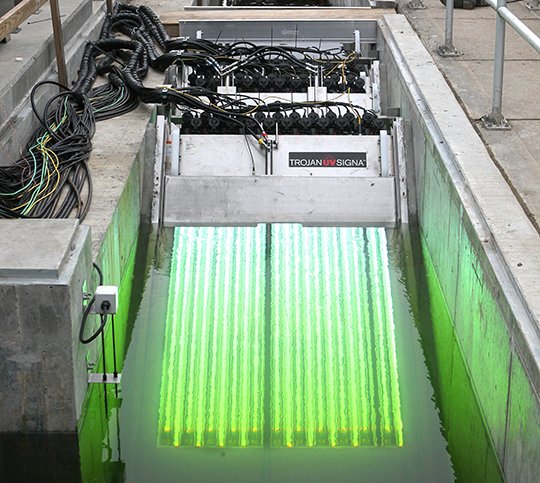
At the Northern Treatment Plant (NTP), effluent from the tertiary process is disinfected using ultraviolet (UV) light. UV light penetrates cell walls, damaging the DNA of these organisms and preventing reproduction. This method of disinfection requires very clean water to limit the shielding of the light from solids, allowing the light to penetrate the cells. This process is a very efficient and effective disinfection method, eliminating the need for chemical addition and the formation of disinfection biproducts.

Water Quality
Hover over the bar graphs below to see how much of the pollutant was removed during a previous treatment process, how much was removed during this treatment process, and how much is left to be removed in a future treatment process.
Key:
Previously removed pollutants from prior processes
Amount of pollutants actively being removed by the current process
Remaining amount of the pollutant
